In the Omnienergy project development plan, the first step was to examine and analyze the data of the relevant energy market and its competitors. After an in-depth analysis of the literature in the field of renewable energy forecasting, it was decided to implement an innovative model to differentiate the Omnienergy project from other competitors in the market. This was achieved through the creation of a machine learning model characterized by the presence of a meta-model with the role of " Orchestra Conductor" that uses several underlying models, dynamically determining in real time the weight of their contributions.
What we do
In-depth analysis of market data and competitors in the energy sector.
Implementation of a machine learning model with an "Orchestra Director" meta-model and several underlying models.
Dynamic adjustment of the contributions of the underlying models to differentiate Omnienergy in the market.
MACHINE LEARNING
Forecast
forecast
forecast
forecast
forecast
forecast
forecast
forecast
forecast
forecast
forecast
A model that makes automatic corrections
At each forecast horizon (12 horizons for the Infraday Market, 24 for the Day-Ahead Market), the Orchestra Director evaluates the quality of the forecasts of the underlying models and dynamically assigns the weight of their contributions. In this way, the underlying models are orchestrated by the meta-model that corrects for errors resulting from forecasts that are far from the actual values for each sub-model, thus distinguishing Omnienergy from its competitors in the market.The project's sub-models are mainly of two types: classical models, widely used among competitors, which use the forecast meteorological data; and autoregressive models, capable of creating an internal wind model to develop its own forecasting system for wind and energy.
The forecast trend
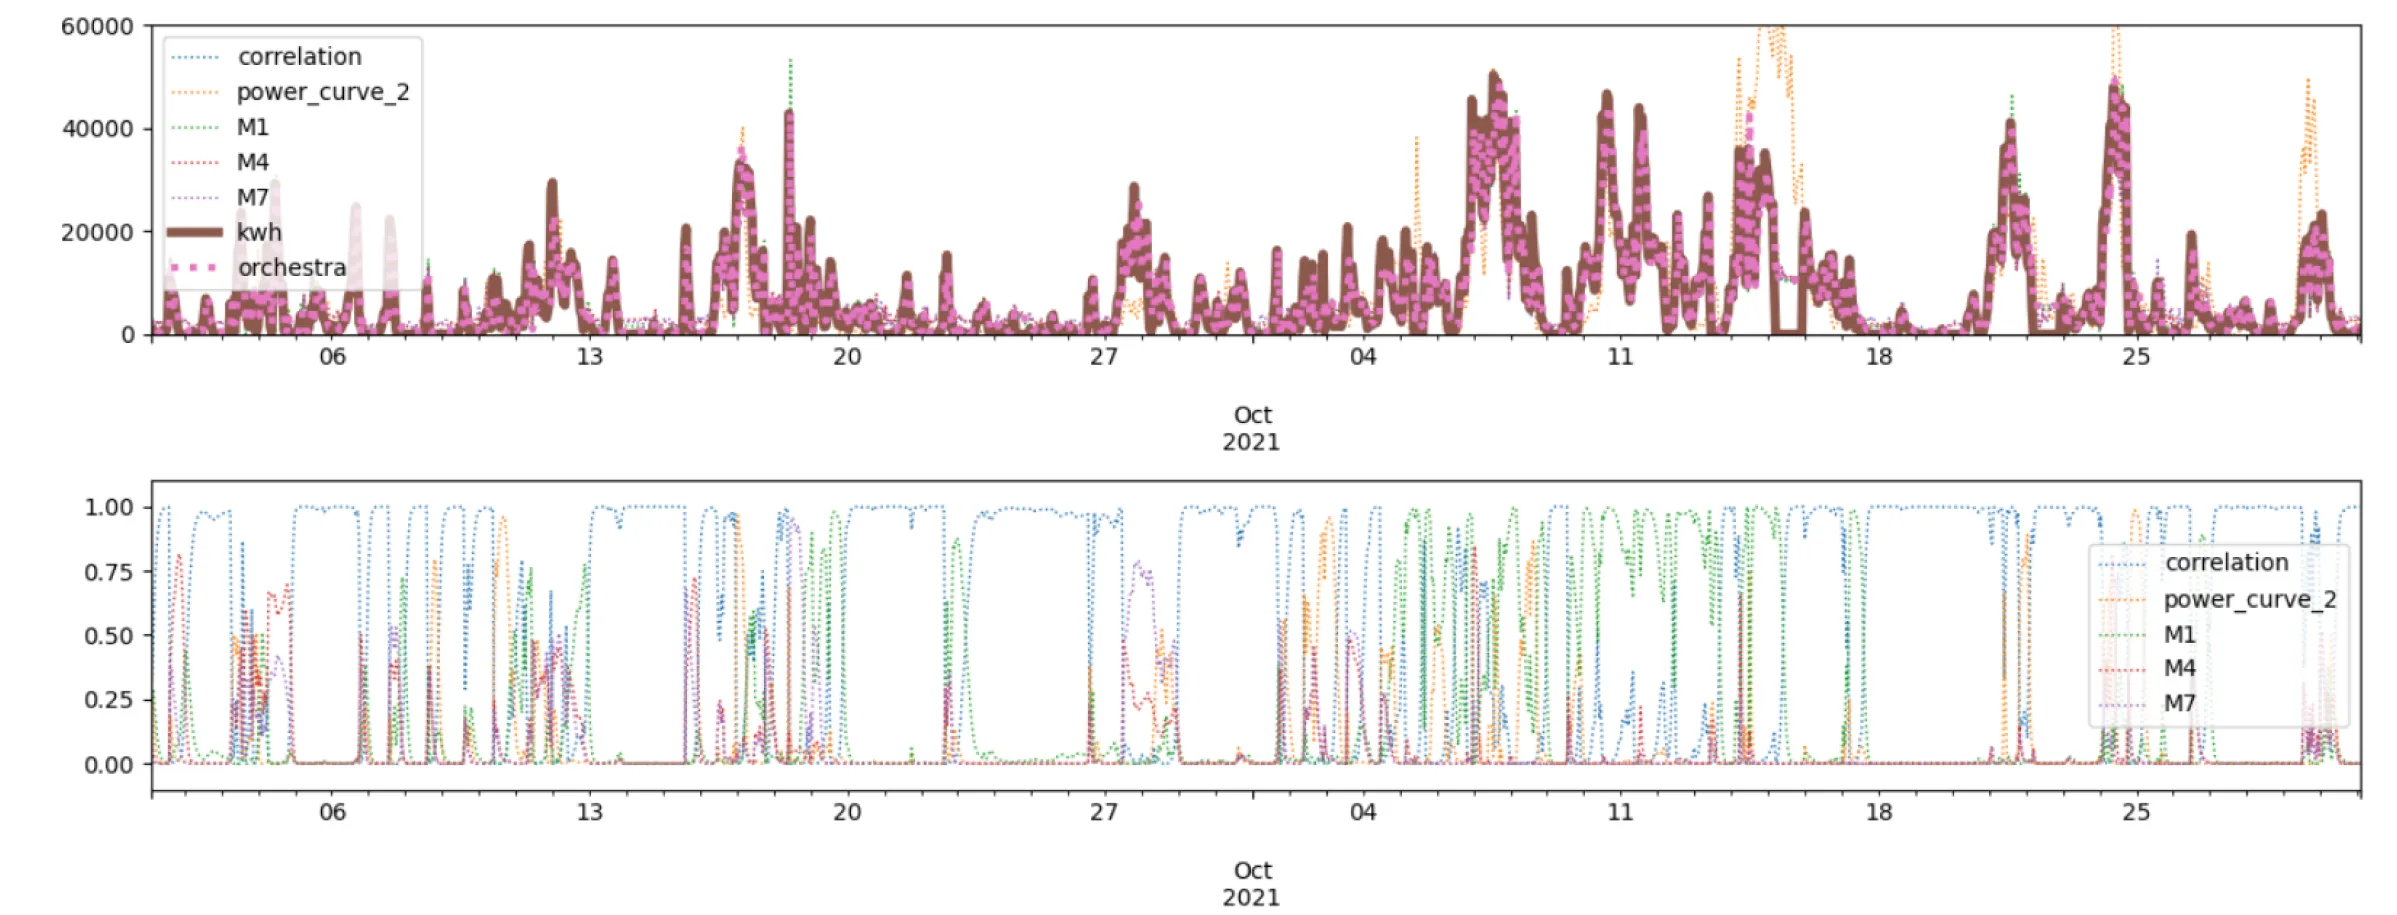
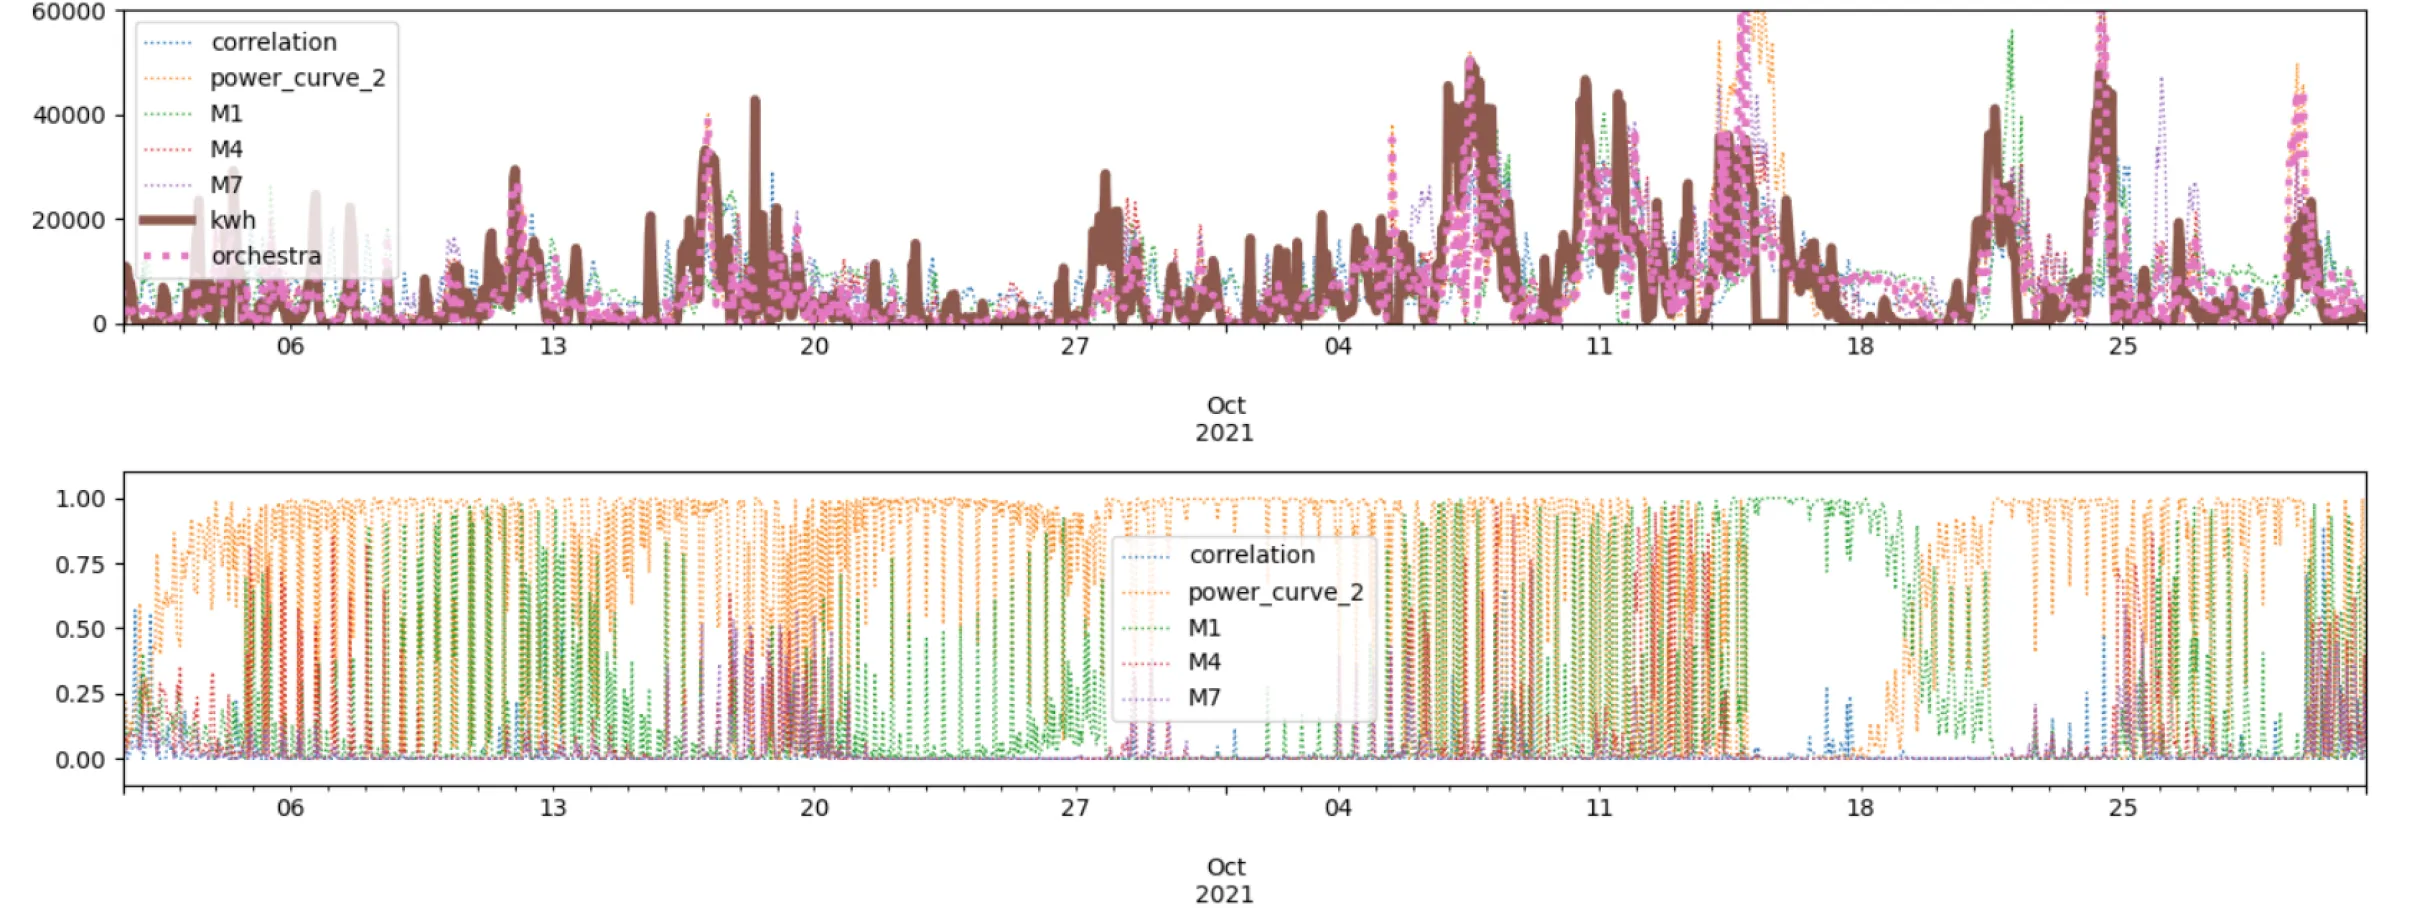
Below is an example of short-term and medium-term (t+1 and t+12) production forecast trends. From the forecast performance in the short and medium term, it can be observed that the Orchestra meta-model favors autoregressive models (which do not make use of weather forecasts) in the case of short horizons, while in the medium term it rewards more the classical type of models (which use as input the forecast weather data at the horizon of interest).
What we do
Dynamic evaluation of the quality of predictions of the underlying models by the Orchestra Conductor.
Automatic correction of errors in forecasts away from real values for each sub-model.
Use of classical and autoregressive sub-models to improve the accuracy of Omnienergy forecasts.
Example of forecast trend of Orchestra model at 1-hour forecast horizon with relative trend of weights assigned to sub-models.
Example of forecast trend of the Orchestra model at 12-hour forecast horizon and relative trend of the weights attributed to the sub-models.
performance
KPI
performance
performance
performance
performance
performance
performance
performance
performance
performance
performance
performance
The indicators for model evaluation
In order to evaluate the best performance of the Orchestra model in comparison with market competitors, KPIs, or indicators, were identified that are useful in defining the success of the project. Among the various performance indicators examined and analyzed, two quantitative metrics were selected that can be measured objectively and describe the performance of the project optimally while also ensuring continuous monitoring of the achievement of the set goals.The two selected KPIs are: NMAE (Normalized Mean Absolute Error) and RMSE (Root Mean Squared Error). The NMAE indicator allows quantification of the average error of the Orchestra model with respect to the maximum power that can be delivered by the considered plant (rated power, in the formula denoted as kWh(max)). This indicator is defined by the expression, for a given forecast horizon h:
Where yt|t-h is the value predicted by Omnienergy at time t-h relative to time t, yt the value of energy input at time t, and T represents the number of observations considered. The RMSE metric, however, allows us to quantify the difference in model output from absolute output: larger errors have a greater proportional impact on the RMSE indicator. This indicator was chosen because it allows monitoring the forecast performance in real time and is defined, for each forecast horizon h, by the following formula:
What we do
Identification of quantitative KPIs to evaluate Orchestra's performance compared to market competitors.
NMAE (Normalized Mean Absolute Error) to quantify the average error in relation to maximum deliverable power.
RMSE (Root Mean Squared Error) to measure the difference in model output from absolute production.
metrics
Competitors
competitors
ccompetitors
competitors
competitors
competitors
competitors
competitors
competitors
competitors
competitors
competitors
Omnienergy vs competitor
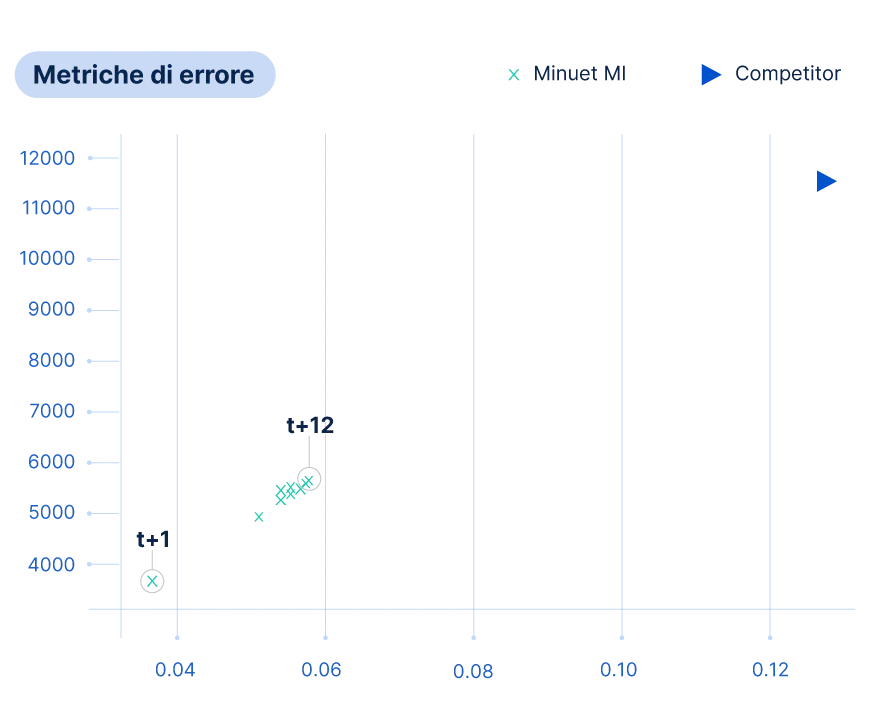
To confirm the higher quality of the Orchestra model's forecasts compared to competitors in the market, below is a comparison of the metrics considered (NMAE and RMSE), calculated for the same test period on forecast data from Omnienergy and one of its main competitors:
As can be seen from the graph, Omnienergy appears to have lower error values than its competitor. It should be noted that the competitor's forecasted production figure is relative to their "best value" as it is calculated based on real-time forecasted weather data.
What we do
Comparison of NMAE and RMSE metrics between Omnienergy's Orchestra model and a main competitor in the energy forecasting market.
Omnienergy has significantly lower errors than the competitor, as highlighted in the graph.
It should be noted that the competitor's forecast value represents their "best result", which further confirms the strength of Omnienergy's Orchestra model.
Want to learn how to build websites like this?
Learn from award winning designers in live online classes. Each class is limited to 15 students. Save you're spot below!